I recently dropped ridiculously expensive cable and opted for a combination of a free over-the-air antennae, streaming Netflix, and downloading via a Newsgroup. Having paid internet with no paid TV service is called “cord cutting” and is a major trend among Generation Y. More specifically, non-subscribers fall into two categories – “evaders” (those who have never purchased subscription-based pay TV) or “defectors” (former subscribers who have cut the cord) – and evidently I’m a “defector” (says the middle aged woman who wrote that article).
In not an economist but I do find the cable industry to be a bizarre playing field. Although not a monopoly at the federal level, many areas of the country operate as such because consumers are left with only a single viable option for cable service (I’ve written about one such monopoly in the past). However, unlike other near monopolies, there is a free alternative to cable which provides (almost) similar quality (although much fewer channels). Imagine if DeBeers, in their monopoly of the diamond market, began giving grade “S” diamonds to the public for free. Would anyone pay egregious amount of money for grade D diamonds? How much better would a diamond need to be for anyone to decide to pay anything for it? Similarly, how much better does MTV need to be for me to pay $70 a month versus settling with HD quality NBC, CBS, ABC, Fox, and PBS for free?
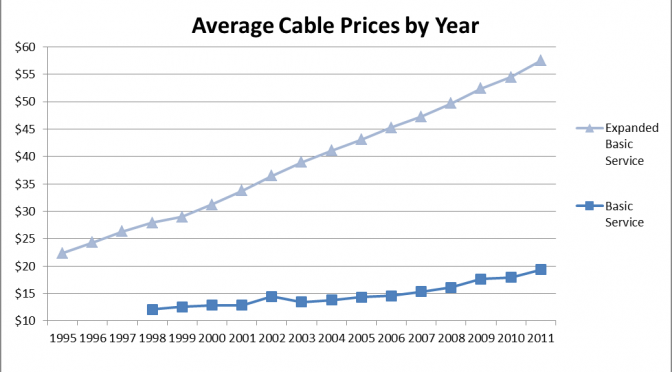
Yet cable didn’t used to cost three times more than a utility bill. The Federal Communications Commission (FCC) lists average costs of cable dating back to 1995 (unfortunately I couldn’t find consistent earlier data):
| Year | Basic Service |
Expanded Basic Service | ||
| Price | # Channels | Price/Channel | ||
| 1995 | – | $22.35 | 44 | $0.60 |
| 1996 | – | $24.28 | 47 | $0.61 |
| 1997 | – | $26.31 | 49 | $0.63 |
| 1998 | $12.06 | $27.88 | 50 | $0.65 |
| 1999 | $12.58 | $28.94 | 51 | $0.65 |
| 2000 | $12.84 | $31.22 | 55 | $0.66 |
| 2001 | $12.84 | $33.75 | 59 | $0.60 |
| 2002 | $14.45 | $36.47 | 63 | $0.66 |
| 2003 | $13.45 | $38.95 | 68 | $0.65 |
| 2004 | $13.80 | $41.04 | 70 | $0.66 |
| 2005 | $14.30 | $43.04 | 71 | $0.62 |
| 2006 | $14.59 | $45.26 | 71 | $0.65 |
| 2007 | $15.33 | $47.27 | 73 | $0.67 |
| 2008 | $16.11 | $49.65 | 73 | $0.68 |
| 2009 | $17.65 | $52.37 | 78 | $0.71 |
| 2010 | $17.93 | $54.44 | 117 | $0.56 |
| 2011 | $19.33 | $57.46 | 124 | $0.57 |
A few definitions according to the FCC:
- Basic Service: The local broadcast stations; public, educational, and governmental access channels; and typically a few additional channels that may be of local, regional, national, or international origin. (required by the Cable Television Consumer Protection and Competition Act of 1992)
- Expanded Basic Service: The combined price of basic service and the most subscribed cable programming service tier excluding taxes, fees and equipment charges
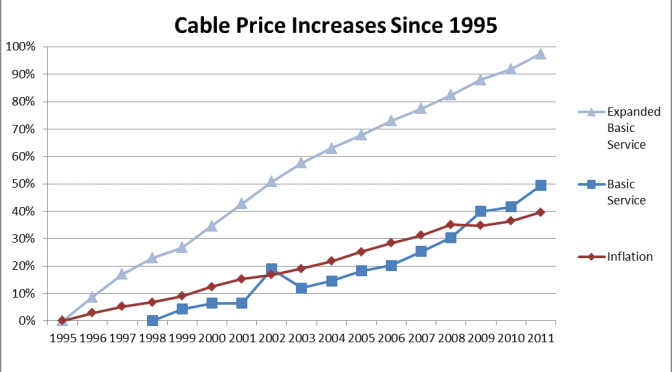
Comparing these prices to inflation of the US Dollar shows that although “Basic Service” (which I don’t believe anyone actually uses) trends similarly with inflation, “Expanded Basic Service” has gotten ridiculous:
A few issues with these prices:
- All of the prices above exclude taxes, fees, and equipment charges. In my experience, these are usually ridiculous so the true cost of cable TV (and its difference from US inflation) is really underrepresented above.
- Although the cost of Expanded Cable has increased at a rate far exceeding cable, the average number of channels available in Expanded Cable has also increased. As a result, the average cost per channel has actually decreased in recent years. In my opinion, however, the percentage of channels actually watched must be at an all time low.